Performance on Remote Locations
Table of contents
Latency
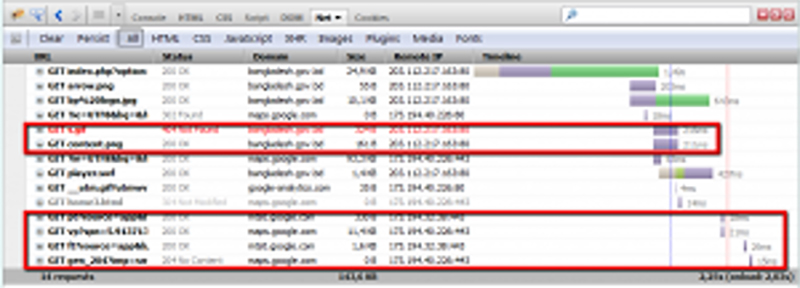
Latency is the time it takes for a package to go from one point in the network to another. The size of the latency is connected to the physical distance between the nodes as well as delays in the network due to passing through different kinds of network components such as routers etc. The longer (physical length) between the nodes and the more network components, the higher latency. When we talk about latency, we usually mean round-trip latency. Round-trip latency is the time it takes for a package to go from the client over the network to the application server and then back again. That is the minimum waiting time it takes for a response to reach the client. It is not unlikely to have a latency of 300ms for locations far away. To understand what latency a specific location has, you can try to Ping it. The measurement that the Ping command return can be seen as the round-trip latency between two nodes. C:>ping 203.112.217.163 Pinging 203.112.217.163 with 32 bytes of data: Reply from 203.112.217.163: bytes=32 time=208ms TTL=48 Reply from 203.112.217.163: bytes=32 time=221ms TTL=48 Reply from 203.112.217.163: bytes=32 time=210ms TTL=48 Reply from 203.112.217.163: bytes=32 time=207ms TTL=48 Ping statistics for 203.112.217.163: Packets: Sent = 4, Received = 4, Lost = 0 (0% loss), Approximate round trip times in milli-seconds: Minimum = 207ms, Maximum = 221ms, Average = 211ms Using the Firebug plugin to Firefox will give you a good picture of where time is spent. In the example below, you can see the difference in waiting time between the calls the goes to the Bangladesh server and the calls that goes to google.com (the purple color indicates waiting time). Also, note that the waiting time corresponds very well to the ping measurements in the above example.

Frames in Frames in Frames
For remote locations with a high latency, it is very important how we design our pages. We would like to load as much as possible in parallel not to be hit by the waiting time overhead over and over again. Take a look at the example below where the data is inside frames which in turn are included in other frames. This approach leads to that the user will be hit by multiple waiting times that are lined up in a serial behavior. The first page requests the first level of frames. When the frames arrive at the client, the client will issue additional requests for the inner frames and when those requests return the client will start fetching the real data.

Bandwidth
Bandwidth for web application traffic when it comes to local usage is never a problem. A normal enterprise PLM web application consumes very little bandwidth. However, users on remote locations with poor infrastructure usually suffer from sharing a low bandwidth between a lot of users. The available bandwidth usually differs a lot during the hours of the day. To give the user a better application experience, it is important to send as little data as possible. Setting low pagination limits in combination with Ajax calls instead of complete reloads of pages will help a lot. Moving rendering logic to the client side instead of always having the server render the data will also cause fewer data to be sent over the network and speed up the experience.
Link quality
Another thing that will impact the performance is the link quality between the nodes. If the quality is bad, your system might suffer from packet loss, which will lead to that data will have to be re-sent between the server and the client. Packet loss will have a severe impact on a high latency network compared to a network with very little delay.
Quality of Service
If your remote offices have a low bandwidth which is more or less fully consumed, it is important to understand what kind of traffic is occupying the network. Depending on what is driving the network load, introducing a Quality of Service in the network could be one way of letting the important enterprise traffic through without too much of queueing. Traffic that potentially takes a lot of the available bandwidth and should be down prioritized are external web traffic, mailbox synchronization, file replication etc. The important part here is to understand what is consuming the bandwidth and then decide what traffic has higher priority.
Testing using Realistic Conditions
It can be cumbersome to be able to test the behavior of your application using realistic conditions for different user locations, and I believe that it is forgotten in many cases. I recommend using a network emulator tool to be able to simulate a user experience at a remote office. The tool described below is a perfect tool for this purpose. It consists of a kind of firewall tool (IPFW) that you use for manipulating the traffic and a service (dummynet) that you hook on to your network card/s to be able to emulate.
IPFW / dummynet – Network emulator tool
dummynet is a live network emulation tool, originally designed for testing networking protocols, and since then used for a variety of applications including bandwidth management. It simulates/enforces queue and bandwidth limitations, delays, packet losses, and multipath effects. Dummynet runs within your operating system and works by intercepting selected traffic on its way through the network stack and passing packets to objects called pipes which implement a set of queues, a scheduler, and a link, all with configurable features (bandwidth, delay, loss rate, queue size, scheduling policy…). Traffic selection is done using the ipfw firewall, which is the main user interface for dummynet. Ipfw lets you select precisely the traffic and direction you want to test on, making configuration and use very simple. You can create multiple pipes, send traffic to different pipes, and even build cascades of pipes.
Installation Instructions
1. Unzip the tool in the c:appsnetwork folder. 2. Add a service to your network card by: 2.1 Open the configuration panel for the network card in use. (either right click on the icon on the SYSTRAY, or go to Control Panel -> Network and Internet -> Network and Sharing Center) 2.2. (Right) click on the network card and choose: Properties->Install->Service->Add 2.3. Click on ‘Have Disk‘ and ‘Browse’ to the c:appsnetworkdummynet folder and select the ‘netipfw.inf‘ file. 2.4. Select ‘ipfw+dummynet‘ (which is the only service you should see) and click ‘OK’. 2.5. Click accept on all dialogues that follows.
IPFW Examples
Set-up a simple emulation of a link with 300ms latency and a bandwidth of 512kb/s and a packet loss off 0.1% for the stage.oldtechnia.com environment: Before applying the rules, let’s take a look at firebug when visiting stage.oldtechnia.com.

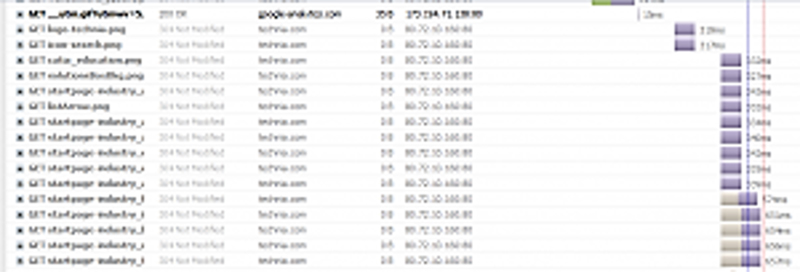
Then we apply the rules by adding the configuration to a pipe and then assigning the routing to the TECHNIA environment to that pipe: > ipfw pipe 1 config delay 300ms bw 512Kbit/s plr 0.01 mask all > ipfw add pipe 1 ip from any to stage.oldtechnia.com You can verify your ipfw configurations by typing: > ipfw pipe show Let’s re-run the same page again and take a look in FireBug: Now we can clearly see that the latency is above 300ms for all calls. These calls are actually good examples because they are 304, meaning that the data is cached and have not been changed, so there is no server-side execution that takes time. Only the turnaround of the client request.

To clean up and remove all applied traffic rules (the rules are persistent, so it is always a good idea to clean up after usage): > ipfw -q flush > ipfw -q pipe flush There are a lot of things that you can do to adjust the traffic to exactly what you want it. It is usually a good idea to ask your (or your customers) network group about the specific characteristics of the link between a certain remote office and the application server to be able to simulate as close to reality as possible. In many cases, you could be just fine by only simulating based on latency and that you can estimate yourself based on the ‘ping’ results. If you do not want to write IPFW commands every time, it is convenient to create .bat files with predefined values for predefined servers/environments. Questions or comments? Feel free to post something in the comments widget below.
Do you think your system could benefit from better performance? Feel free to reach out to us.


